How to add another server on node-exporter and prometheus and Structure.🚀

🌐 DevOps Enthusiast | Cloud & System Administrator | WordPress Expert With 2+ years of experience, I specialize in cloud infrastructure, server management, and WordPress development. At Appharu PVT. LTD., I optimize systems, reduce costs, and implement monitoring solutions. Experienced in deploying 50+ WordPress sites, AWS S3 integration, and troubleshooting technical issues, I’m focused on performance, security, and continuous learning in DevOps and automation.
Prometheus acts as the server, scraping and storing metrics from Node Exporter, the client, which collects system-level metrics (CPU, memory, disk, etc.) and exposes them at http://server_ip:9100/metrics. Prometheus is configured to scrape this endpoint, storing the data in its time-series database. You can visualize the metrics using Prometheus' UI or integrate it with Grafana for advanced dashboards.
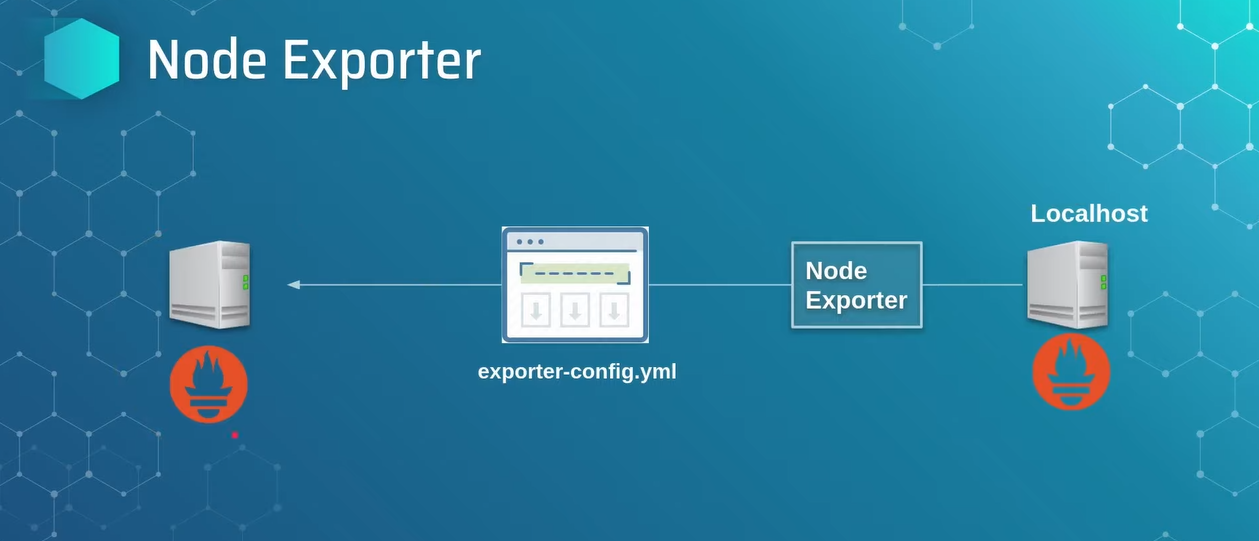
➡How to add another server:
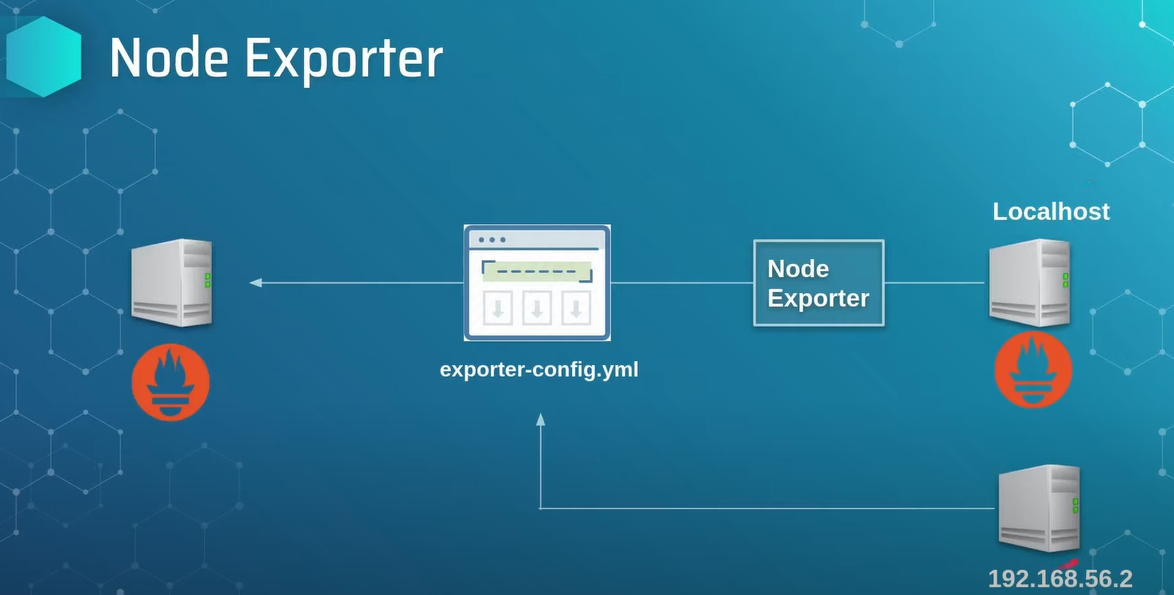
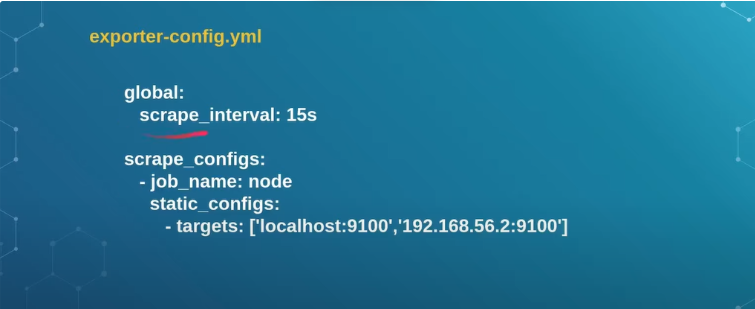
➡Inside prometheus directory exporter-config.yml file add ip_address.
On Next blog: How to install Grafana and how to connect with prometheus and node-exporter.
If you have any questions or face issues, feel free to drop a comment below or mail me at birendra2783@gmail.com!


