How to install node-exporter on linux and how to connect with prometheus .🎯

🌐 DevOps Enthusiast | Cloud & System Administrator | WordPress Expert With 2+ years of experience, I specialize in cloud infrastructure, server management, and WordPress development. At Appharu PVT. LTD., I optimize systems, reduce costs, and implement monitoring solutions. Experienced in deploying 50+ WordPress sites, AWS S3 integration, and troubleshooting technical issues, I’m focused on performance, security, and continuous learning in DevOps and automation.
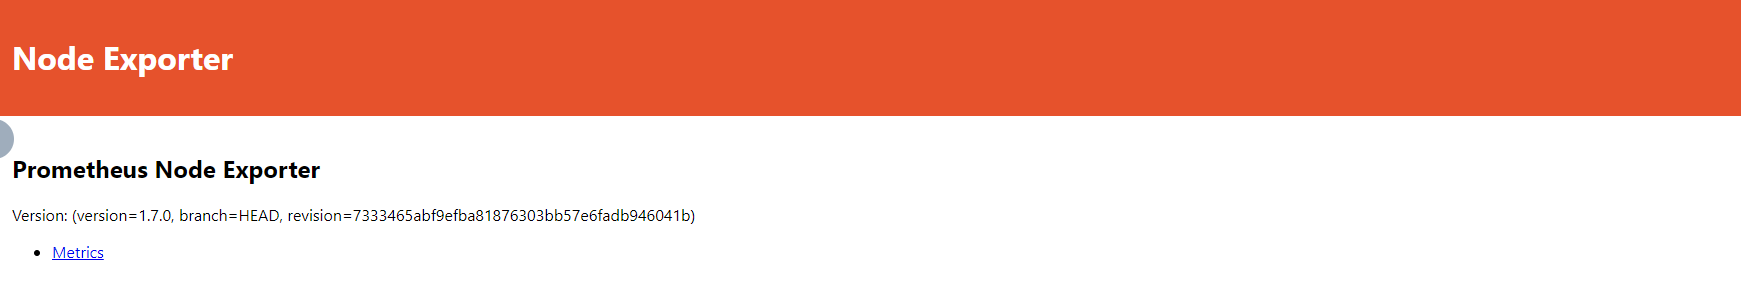
Node Exporter is a lightweight tool that exposes system-level metrics (CPU, memory, disk, network) for Prometheus monitoring. It collects hardware and OS stats, runs with minimal resources, and integrates seamlessly with Prometheus and Grafana. Metrics are available at /metrics on port 9100, making it ideal for monitoring server performance and health in production environments.
➡Create a directory .
command: mkdir node-exporter
➡Go to that directory.
command: cd node-exporter
➡Download node-exporter zip-file
command: wget https://github.com/prometheus/node_exporter/releases/download/v1.7.0/node_exporter-1.7.0.linux-amd64.tar.gz
➡Unzip node-exporter file.
command: tar xvfz node_exporter-1.7.0.linux-amd64.tar.gz
➡Go to that directory.
command: cd node_exporter-1.7.0.linux-amd64
➡Run the command.
command: ./node_exporter
➡Go the browser and run.
URL https://server_ip:9100
https://server_ip:9100/metrics
➡we need to create text-file inside prometheus/prometheus- 2.35.0.linux-amd64/exporter-config.yml .
- To connect with pormetheus
command: vim exporter-config.yml
- script
global:
scrape_interval: 15s
scrape_configs:
- job_name: node
static_configs:
- targets: ['localhost:9100']
save and exit command :wq
➡Run
command: ./prometheus --config.file=exporter-config.yml
➡conclusion:
Setting up Node Exporter involves downloading, extracting, and running the Node Exporter binary to expose system-level metrics. To integrate it with Prometheus, you need to create a configuration file specifying Node Exporter's endpoint (localhost:9100). Once configured, Prometheus can scrape metrics from Node Exporter, allowing you to monitor hardware and operating system performance through Prometheus' web interface. This setup ensures seamless system monitoring and enhances visibility into server health.
If you have any questions or face issues, feel free to drop a comment below or mail me at birendra2783@gmail.com!


